MEDIA CONSUMPTION & DEVICE OWNERSHIP

Computer
89% of Asian American households have a computer, over-indexing against the total population by 13%.

Smart Phone
97% of Asian American households have a smartphone, over-indexing against the total population by 6%

Television
The majority (67%) of the Asian American household own traditional TV, and every 4 in 5 families have access to SVOD service.
TIME SPENT ON EACH DEVICE
- Asian Americans adults spend the most time each week watching TV—almost 23 hours/week
- Television and apps/web on a smartphone have the highest weekly reach among Asian Americans (78% and 84%, respectively)
Weekly Time on Device (hours: minutes) Users Aged 18+
Asian American | Total Population | |
Total Use of Television | 22:59 | 36:29:00 |
Live + Time-Shifted TV | 18:43 | 32:10:00 |
Time-shifted TV | 4:23 | 6:23 |
TV-Connected Devices | 9:14 | 9:58 |
App/We on a Smartphone | 21:39 | 21:59 |
Internet on a Computer | 7:15 | 6:46 |
App/Web on a Tablet | 10:13 | 10:55 |
INFORMATION CHANNEL
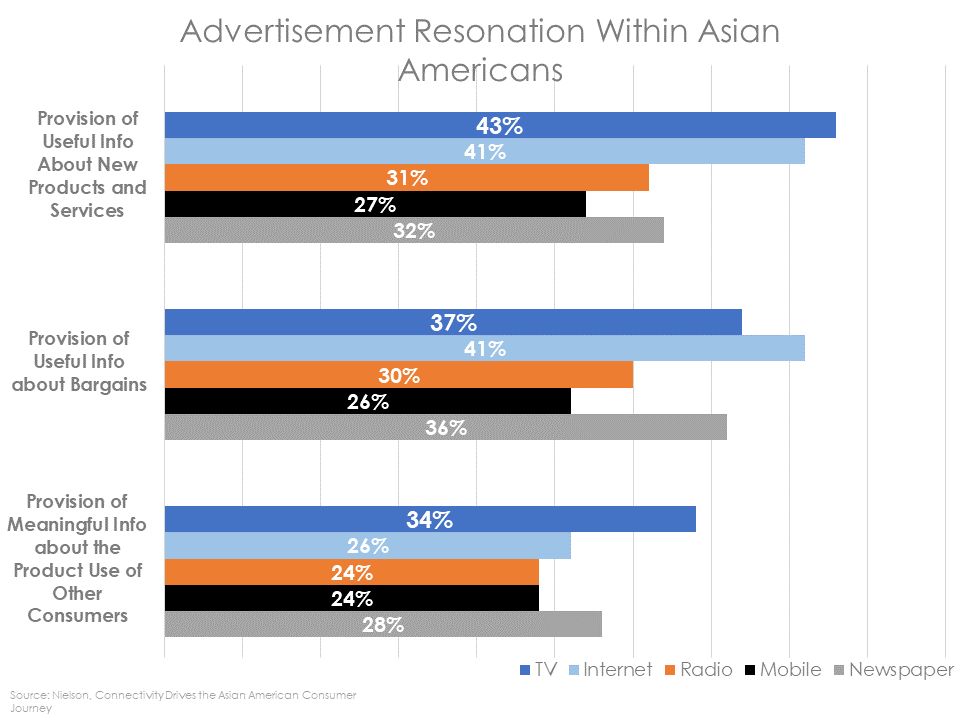
- TV and Internet are the 2 most important channels for information
- TV is the most important channel to learn about new products/services
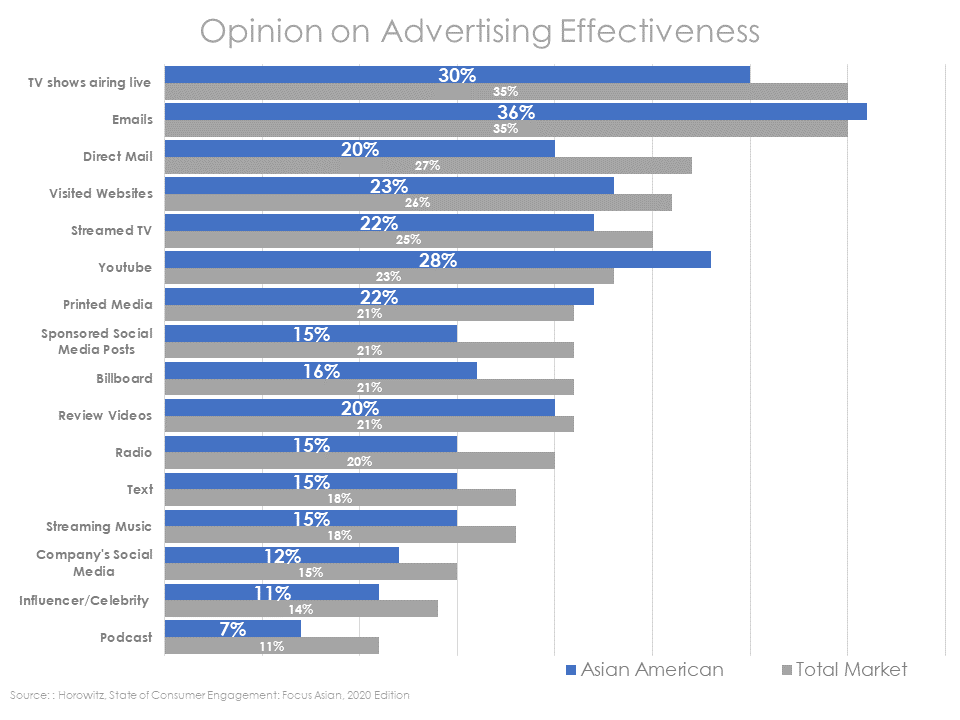
- TV, Youtube, and email are the 3 most effective advertising platforms to reach Asian Americans
Asian American Advertising Platform Attitudes
ASIAN CONTENT/ MEDIA CONSUMPTION
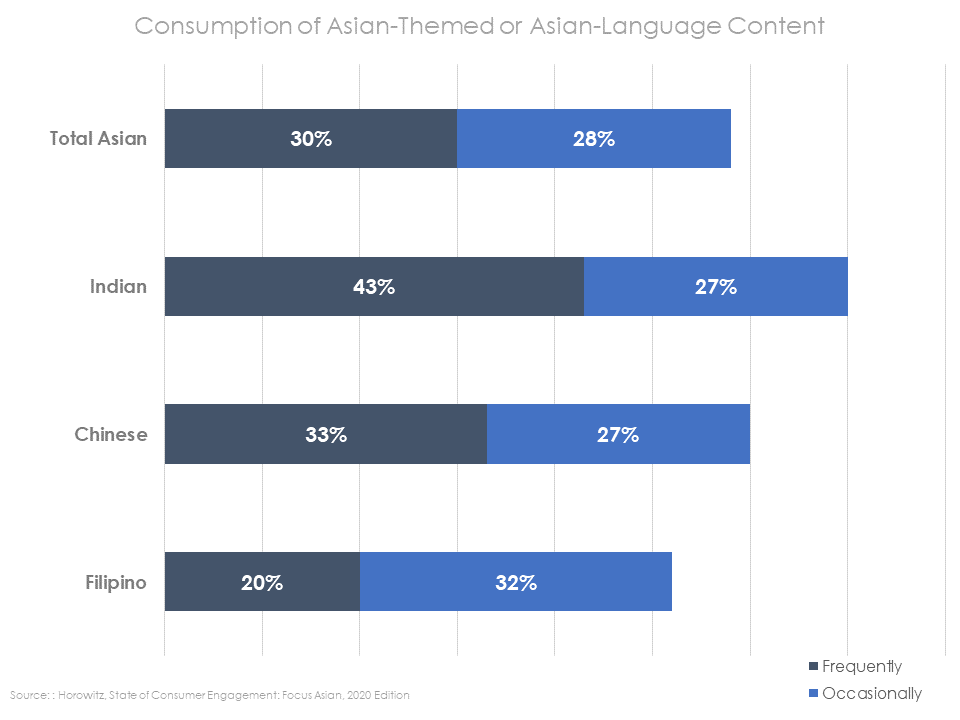
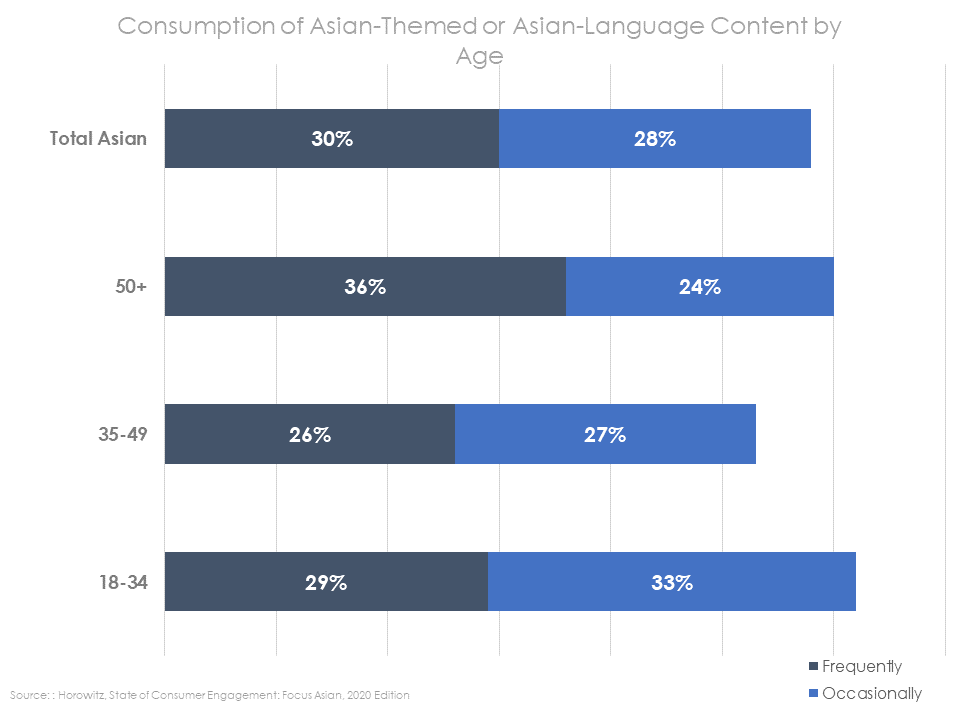
- Over half of Asian Americans consume Asian content.
- Among all sub-Asian groups, Indian and Chinese American consumers are most likely to consume Asian content.
- Asian Americans over 50 years old and between the age of 18-34 are more likely to consume Asian content compared to other age groups.
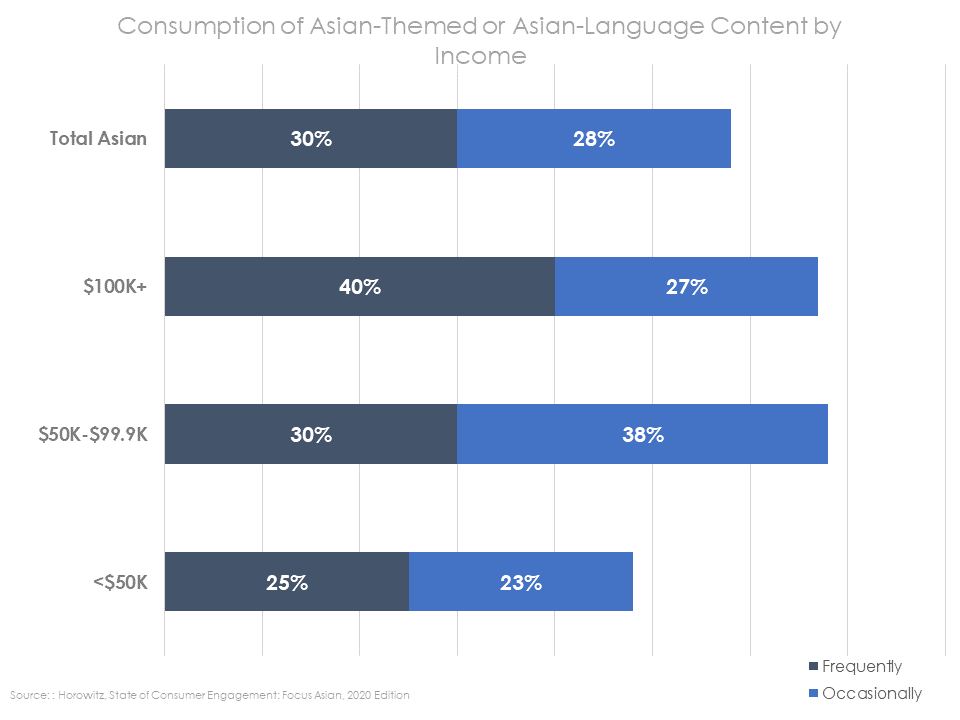
- Asian Americans with an income of $50,000 and over are more likely to consume Asian content than those with an income lower than $50,000.
Asian Themed Media Consumption
Data source: Nielson, The Asian American Consumer Journey (2019) Report; Horowitz, State of Consumer Engagement: Focus Asian, 2020 Edition