ASIAN AMERICAN VOTERS

Around 4 million Asian Americans voted in the 2020 General Election - a massive increase from just under 2.8 million who voted in the 2016 election.
WHERE ARE THEY?
California is home to 4.8 million eligible Asian American voters, followed by New York (1.2 million), Texas (1.2 million), Hawaii (717,019) and Washington (664,653).
| State | Eligible voter population | Asian eligible voter population | % Asian among eligible voter population | % eligible to vote among Asian population |
| California | 26,080,000 | 4,360,000 | 17% | 62% |
| New York | 14,080,000 | 1,155,000 | 8% | 57% |
| Texas | 19,955,000 | 1,050,000 | 5% | 54% |
| Hawaii | 1,055,000 | 580,000 | 55% | 71% |
| New Jersey | 6,460,000 | 575,000 | 9% | 55% |
| Washington | 5,590,000 | 540,000 | 10% | 54% |
| Florida | 16,145,000 | 515,000 | 3% | 59% |
| Illinois | 9,085,000 | 495,000 | 6% | 56% |
| Virginia | 6,425,000 | 445,000 | 7% | 59% |
| Pennsylvania | 9,970,000 | 325,000 | 3% | 54% |
| Georgia | 7,885,000 | 320,000 | 4% | 54% |
| Massachusetts | 5,135,000 | 310,000 | 6% | 52% |
| Maryland | 4,410,000 | 280,000 | 6% | 56% |
| Nevada | 2,225,000 | 245,000 | 11% | 65% |
| North Carolina | 7,950,000 | 225,000 | 3% | 51% |
| Arizona | 5,320,000 | 215,000 | 4% | 58% |
| Michigan | 7,655,000 | 215,000 | 3% | 51% |
| Minnesota | 4,270,000 | 210,000 | 5% | 58% |
| Ohio | 8,975,000 | 185,000 | 2% | 49% |
| Oregon | 3,200,000 | 180,000 | 6% | 62% |
| Colorado | 4,370,000 | 170,000 | 4% | 58% |
| Wisconsin | 4,520,000 | 120,000 | 3% | 53% |
| Connecticut | 2,670,000 | 105,000 | 4% | 50% |
| Indiana | 5,060,000 | 105,000 | 2% | 49% |
| Tennessee | 5,325,000 | 100,000 | 2% | 55% |
| Missouri | 4,705,000 | 95,000 | 2% | 53% |
| Oklahoma | 2,935,000 | 70,000 | 2% | 56% |
| South Carolina | 4,040,000 | 70,000 | 2% | 56% |
| Utah | 2,285,000 | 70,000 | 3% | 54% |
| Louisiana | 3,440,000 | 65,000 | 2% | 60% |
| Kansas | 2,135,000 | 60,000 | 3% | 51% |
| Iowa | 2,385,000 | 50,000 | 2% | 48% |
| Alabama | 3,870,000 | 50,000 | 1% | 47% |
| Kentucky | 3,425,000 | 45,000 | 1% | 50% |
| Alaska | 540,000 | 40,000 | 7% | 58% |
| Arkansas | 2,260,000 | 30,000 | 2% | 49% |
| New Hampshire | 1,120,000 | 30,000 | 3% | 57% |
| New Mexico | 1,560,000 | 30,000 | 2% | 51% |
| Delaware | 770,000 | 30,000 | 4% | 51% |
| Nebraska | 1,425,000 | 30,000 | 2% | 45% |
| Rhode Island | 825,000 | 30,000 | 3% | NA |
| Idaho | 1,415,000 | 30,000 | 2% | NA |
| District of Columbia | 505,000 | 25,000 | 5% | NA |
| Mississippi | 2,230,000 | 20,000 | 1% | NA |
| Maine | 1,120,000 | 15,000 | 1% | NA |
| West Virginia | 1,410,000 | 15,000 | 1% | NA |
| Montana | 880,000 | 10,000 | 1% | NA |
| Vermont | 525,000 | 10,000 | 2% | NA |
| North Dakota | 585,000 | 10,000 | 1% | NA |
| South Dakota | 675,000 | 10,000 | 1% | NA |
| Wyoming | 440,000 | 5,000 | 1% | NA |
DEMOGRAPHIC CHARACTERISTICS
Origin
Over 50% of Asian American Voters are foreign-born

Gender
Over half of Asian American Voters identify as female

Age
Asian American voters are the 2nd oldest voter group.

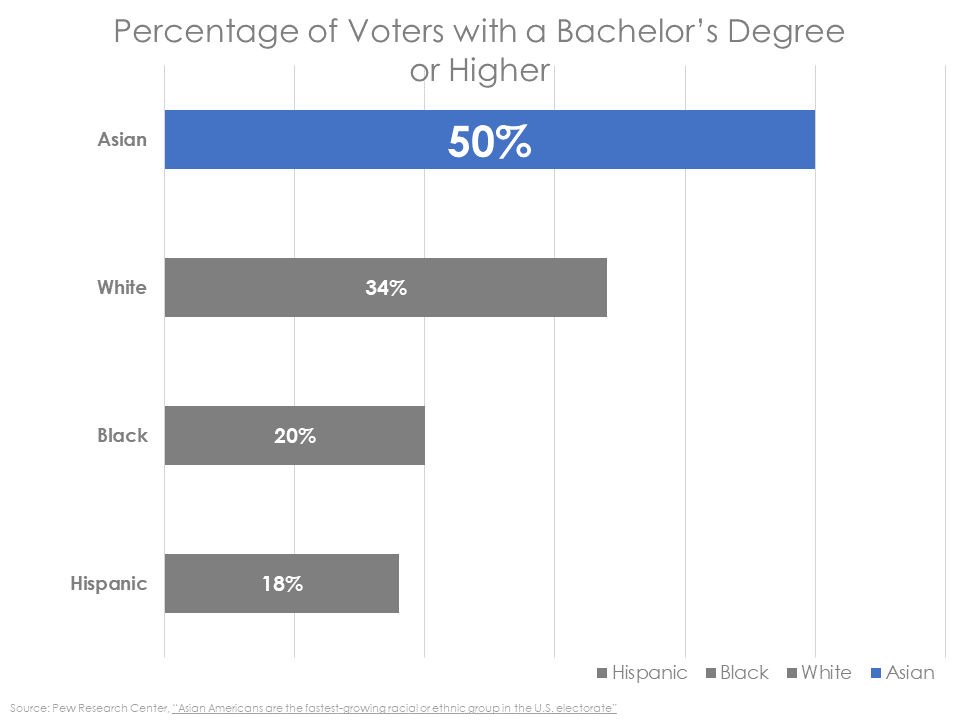
Education
50% Asian American voters have a bachelor’s degree or higher, the highest among all ethnic groups.
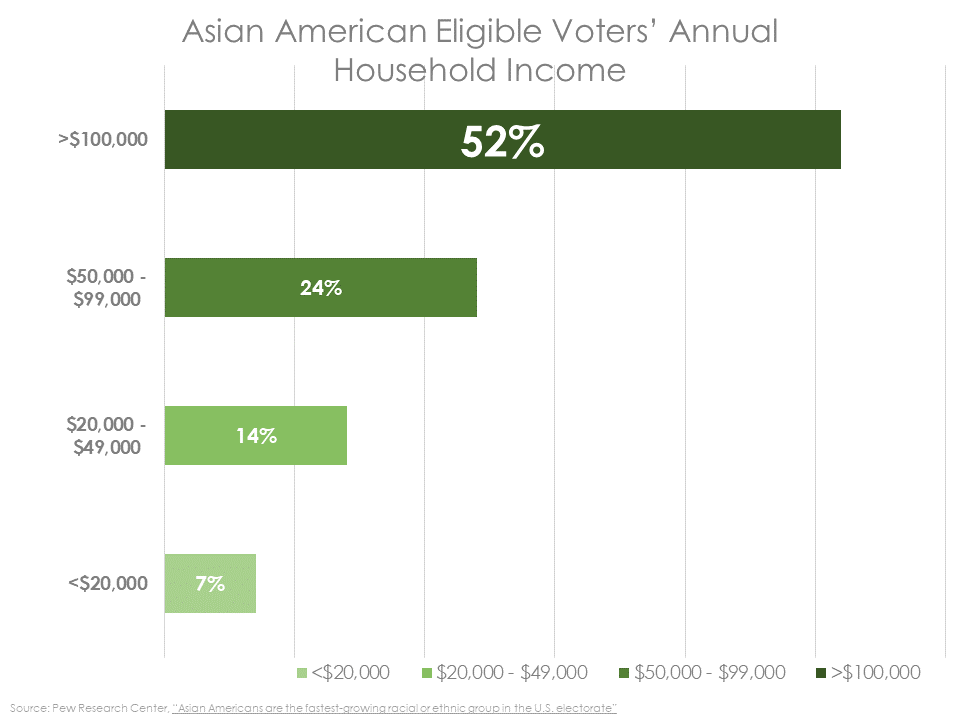
Income
The majority of Asian American voters have an annual household income of $105,000 or more.
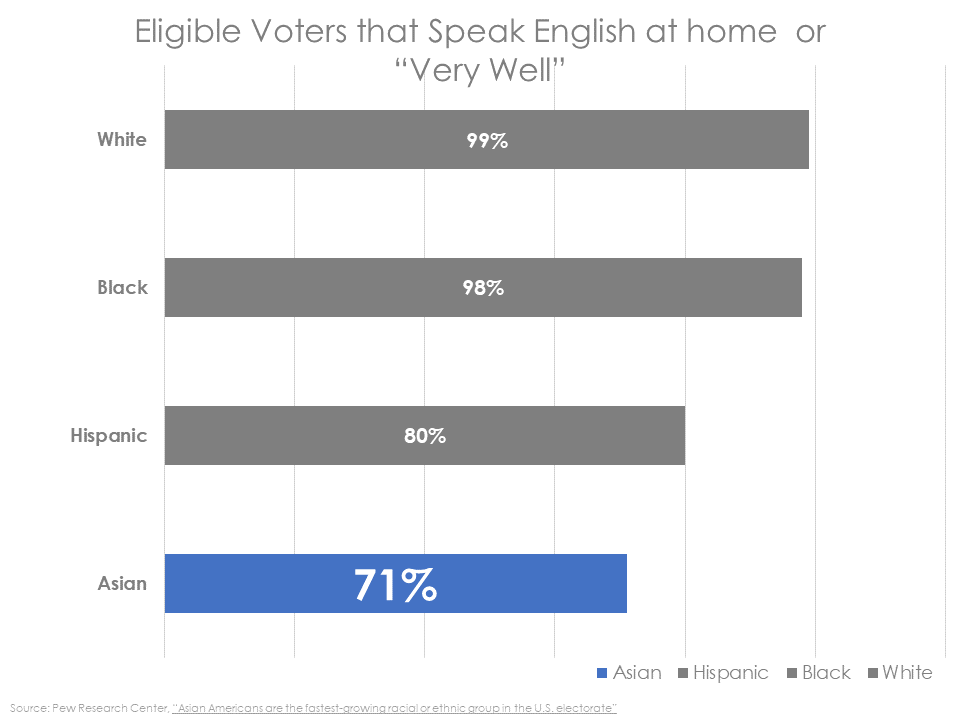
Language
Every 1 in 3 Asian American voters may need non-English language assistance.
OPINIONS AND PREFERENCES
Party Identification
42% of Asian Americans identify as Democratic (vs 22% as Republican), while 31% identify Independent/no party.

Trump Favorability
The majority of Asian American voters have an unfavorable opinion of Trump, except Vietnamese Americans.

Harris Favorability
The majority of Asian American voters have a favorable opinion of Harris, especially among Asian Indians.

Presidential Vote
Harris (66%) vs Trump (28%)

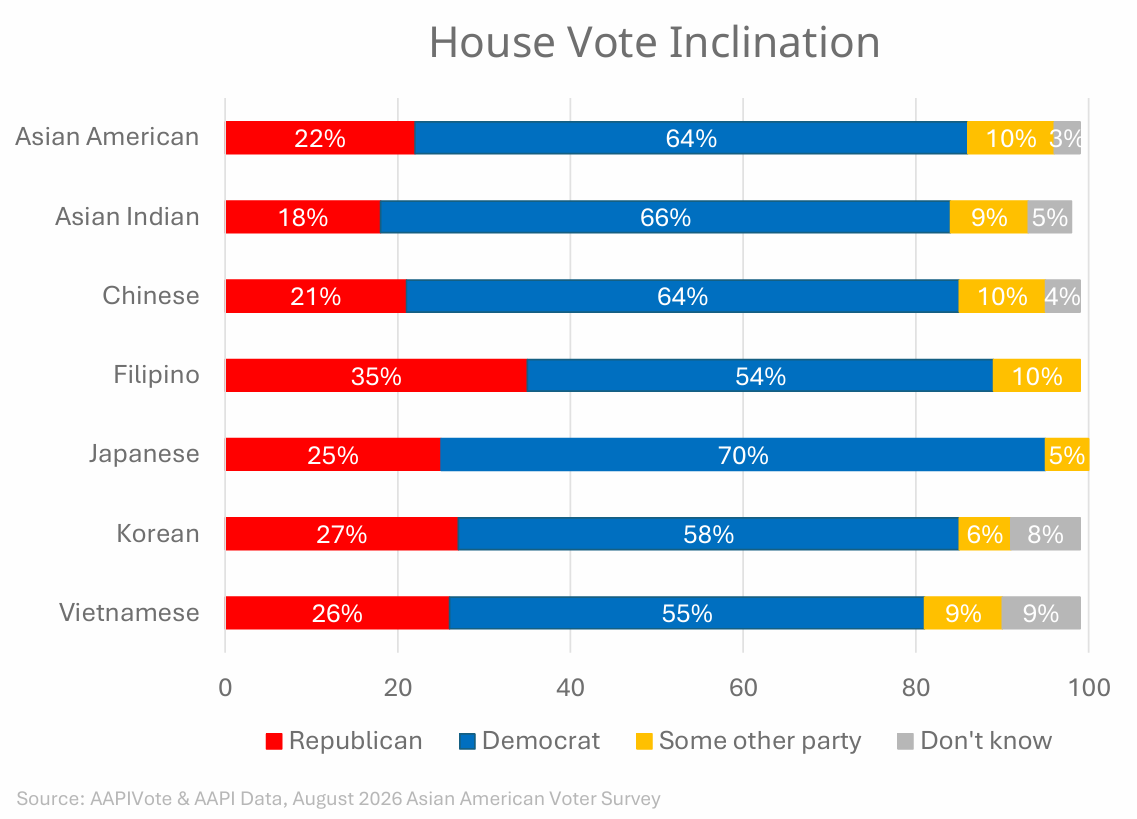
House Vote
Democratic (64%) vs Republican (22%)
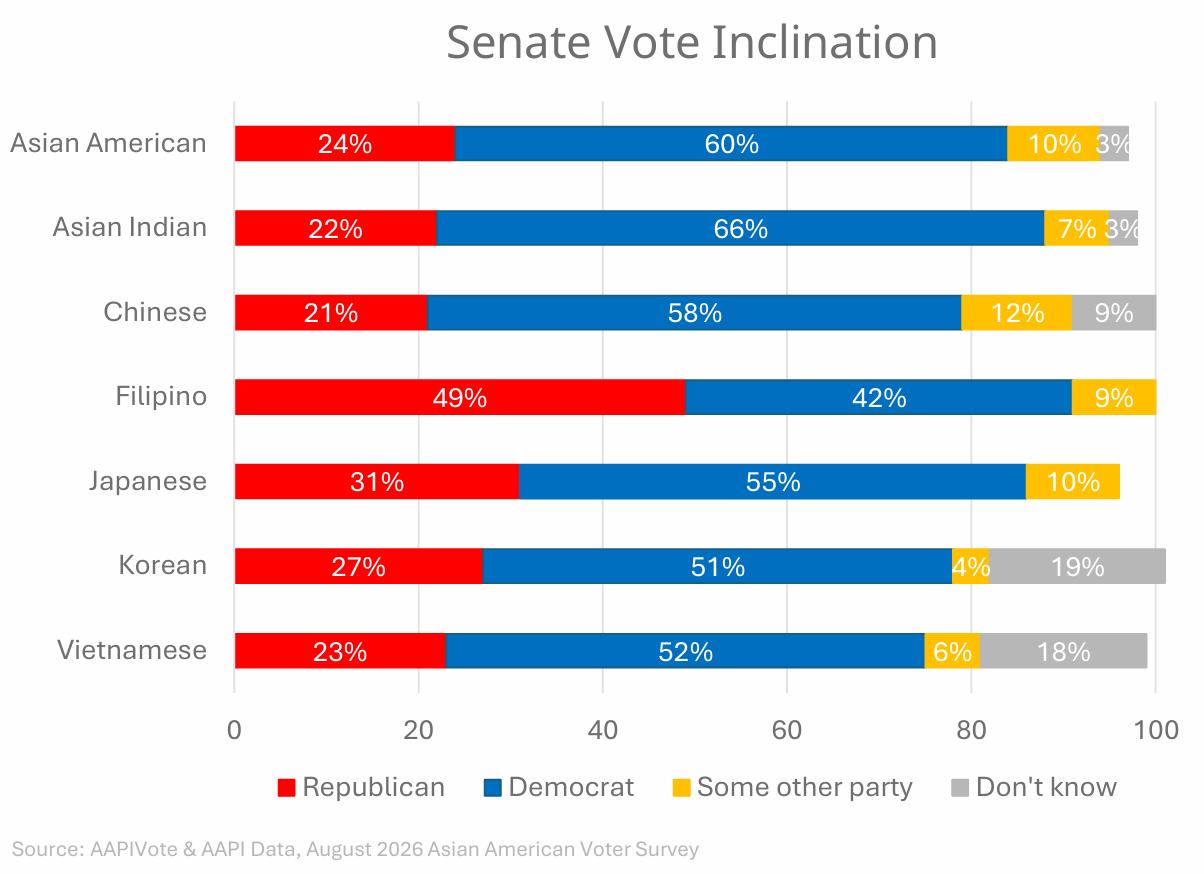
Senate Vote
Democratic (60%) vs Republican (24%)
Issue Support Among Asian American Voters (2026)
Percent of Asian American Voters rating issue as “Extremely Important”, APIAVote & AAPI Data, August 2026 Asian American Voter Survey
VOTER OUTREACH
Many Asian American eligible voters have NOT been contacted by either the Democratic or Republican party.
Democratic Party
Republican Party
Percentage of Asian American eligible voters reported NOT being reached by a political group in the past year. APIAVote & AAPI Data, August 2026 Asian American Voter Survey
Source: APIAVote, 2026 Asian American Voter Survey